Ratio Analysis is an extremely important and versatile tool in the world of finance and accounting. The DuPont Model of ratio analysis is a particularly helpful model that logically leads students down a structured approach of analyzing a company using ratios.
Did you achieve your goals this year? How were you able to achieve your goals? Or why were you not able to achieve your goals? Ratio analysis using the Dupont model will answer these questions if I were to ask the same questions of a company.
There are various views on what should be the primary objectives of a company or corporation. However, providing a reward or return to the investors in the company is considered one of the primary objectives of a company. This chapter will help you answer the following questions by looking at the financial statements.
- Is a company achieving its primary objective?
- What is the return provided to investors and how is it calculated?
- How is this company able to provide this return to its shareholders?
- How efficiently is it managing its assets?
- Has the company leveraged debt to boost its return to shareholders?
- Does the company rely on a profit margin to generate returns to equity or does it rely on generating more sales volume?
Comparisons: Ratio Analysis is Relative
Like any other evaluation, a company’s performance evaluation is difficult on a standalone basis. For example, knowing my body temperature alone is not helpful. I must know what the normal body temperature is for the general adult population so that I can compare my temperature with the normal range and decide if I am suffering from a fever! I must also compare my temperature with other similar species of adults and not fish or animals as their body temperature range may be very different.
Similarly, it is important to evaluate a company’s performance relative to appropriate benchmarks. In the case of a company, the appropriate benchmarks would be other companies in the same industry or the industry average. It is not appropriate to compare a retailer like Walmart to a pharmaceutical company like Merck as their business models are different. In evaluating Apple’s performance, we will use Microsoft’s performance as the benchmark. Be aware that Apple and Microsoft are not exactly identical – Microsoft is more of a software company while Apple is a hardware and software company put together. We will see the result of this difference crop up in many places.
Return on Equity
The return on equity ratio provides a measure to evaluate if the company is achieving its primary objectives. The return on equity ratio measures the return provided to the investors of a company. It looks at the net income in relation to the investments made by the equity investors. The return on equity ratio shows the ratio or percentage of the equity investment that was generated as income for the relevant period.
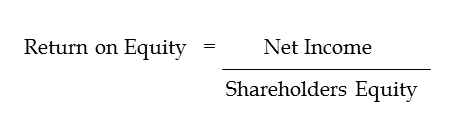
The return on equity ratio is computed by dividing a company’s net income by the company’s shareholders’ equity. Remember that the net income is arrived at in the income statement and represents the net income for a period of time. The shareholders equity however may be different at the beginning of this period and at the end of this period! Therefore we must take the average of the beginning and end shareholders’ equity as the denominator when computing the return on equity.
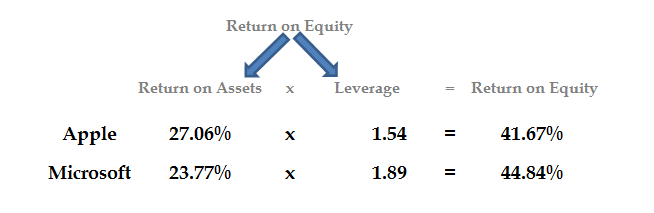
Is Apple providing a return to the equity investors? Is Apple doing better than Microsoft and other competitors in this industry? Yes, it is currently providing a fantastic return to its equity investors! We can see that Apple’s return on equity is 41.67%. This indicates that for every $100 of equity capital, Apple is able to generate $41.67 in net income.
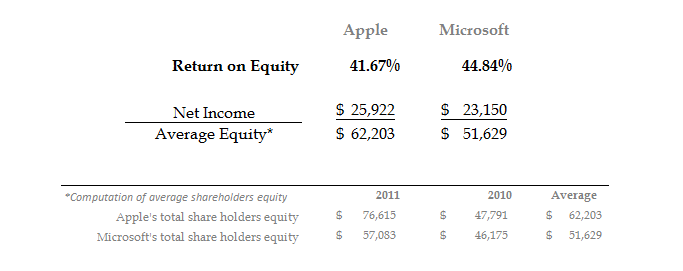
We also see that Microsoft’s return on equity is higher than Apple’s return on equity!
Components Of The Return On Equity
That is interesting: How is Microsoft able to provide a higher return on equity to its investors than Apple is able to? This is surprising especially since we have seen in the earlier chapters that Apple has been growing at a very high rate. The DuPont model is very helpful in addressing this question.
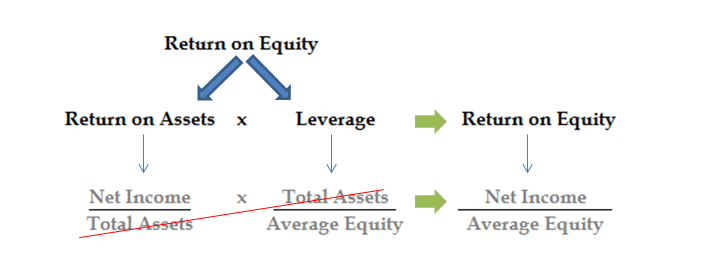
The DuPont model breaks down the return on equity into two components: return on assets and leverage. How is the return on equity equal to the product of the return on assets multiplied by the leverage? When the return on assets and leverage ratios are laid out, the total assets cancel out on both the return on assets ratio and leverage ratio leaving you with the components of the return on equity. Thus the return on equity is the product of the return on assets ratio and the leverage ratio.
Return on Assets
The return on assets measures the return a company is able to generate in relation to the total assets of the company (in percentage terms). Since the total assets of the company will always be equal to the capital used by the company, the return on assets shows the return provided to the capital providers (capital raised from equity investors and lenders to the company) of the company. The return on assets ratio shows the percentage of assets generated as income for the relevant period.
The return on assets ratio is computed by dividing a company’s net income by the total assets used. Remember that the net income is arrived at in the income statement and represents the net income for a period of time. The total assets however may be different at the beginning of this period and at the end of this period as new assets may have been acquired during the period. We therefore take the average of the beginning shareholders’ equity and ending shareholders’ equity as the denominator while computing the return on assets.
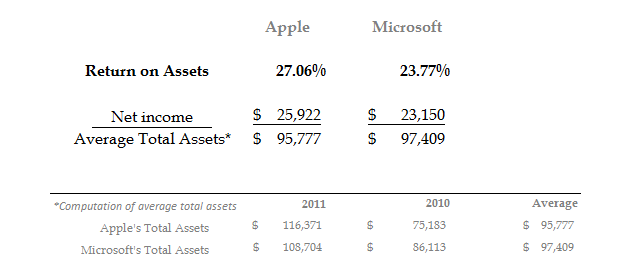
Is Apple providing a good return on assets? Is Apple doing better than Microsoft and other competitors in this industry in this regard? Yes, it is currently providing a fantastic return to its capital providers (equity and debt)! We can see that Apple’s return on assets is 27.06%. This indicates that for every $100 of total assets, Apple was able to generate $27.06 in net income. We can also see that this return on assets is higher than for Microsoft which has a lower return on assets at 23.77%!
Well, if Apple’s return on assets is higher than Microsoft’s return on assets, why is it that Apple still has a lower return on equity?
Leverage
Understanding the leverage ratio of Apple and Microsoft will help you understand why Apple’s return on equity is lower than that of Microsoft even though Apple has a higher return on assets than Microsoft’s return on assets.
Companies use debt as a source of finance to increase assets or earning capacity. The leverage ratio measures the amount of debt (also called leverage) a company has used in relation to its equity. In other words the leverage ratio is the total assets to total equity ratio for a company. As mentioned earlier, both the total assets and total equity may be different at the beginning of this period and at the end of the period. New assets may have been acquired and new equity may have been issued during the period. We therefore take the average of the beginning and ending total assets and total equity values to compute the leverage ratio.
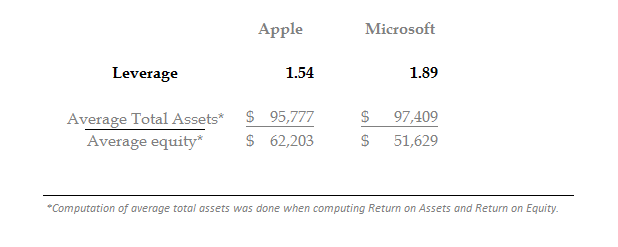
We can see that Apple’s leverage is 1.54 and Microsoft’s leverage is 1.89. Because Microsoft’s higher leverage of 1.89 is multiplied by its return on assets, it is able to generate a higher return on equity than Apple despite having a lower return on equity than Apple.
Thus we see that leverage is able to help Microsoft gain a higher return on equity than Apple despite a lower return on assets. This is the power of leverage. This is one effect of using debt. You will cover other effects of debt when you study finance.
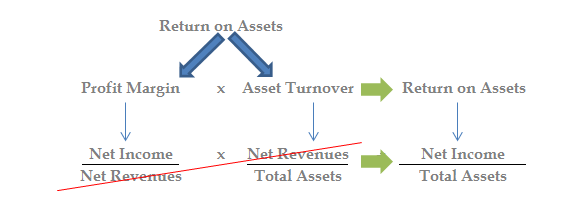
Components Of The Return On Assets
Why is Apple able to generate a higher return on assets than Microsoft? We can answer this question by breaking down the return on assets into its separate components. How is the return on assets equal to the product of the profit margin multiplied by the asset turnover? We can see that the net sales in the profit margin ratio and the asset turnover ratio cancel out and you are left with the components of the return on assets.
Profit Margin
The profit margin reflects the profitability of the company or the margin that the company is able to keep on its sales. If a company has a dollar of sales or revenue and it cost the company 80 cents to generate the sales, we would say it has a 20% profit margin (computed as (($1-0.80)/$1)*100% = 20% profit margin). In other words the profit margin reflects the excess of selling price over costs as a percentage of the selling price. The profit margin of a company is arrived at by dividing its net income by its net revenues.
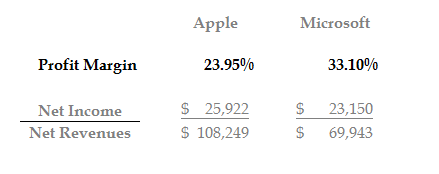
We can see that Microsoft’s profit margin is higher than Apple’s profit margin. This is because Apple also sells hardware which has higher per unit costs than software.
Asset Turnover
The asset turnover ratio reflects how many dollars of sales the company was able to generate out of each dollar of assets it has. The asset turnover ratio shows how effectively the company has used its assets to generate sales.
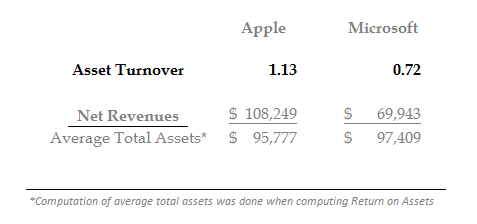
As mentioned earlier, the total assets may be different at the beginning of this period and at the end of the period. New assets may have been acquired or assets may have been sold during the period. We therefore take the average of the beginning and ending total assets to compute the asset turnover ratio.
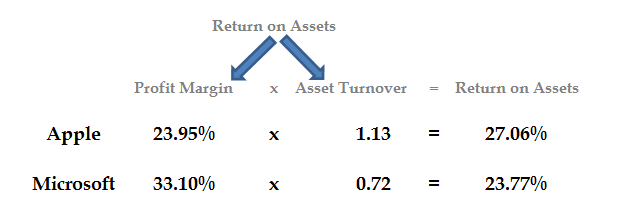
When we look at the profit margin and asset turn over ratios of Apple and Microsoft, we can see that Microsoft is able to generate a higher profit margin. However, Apple has a higher asset turnover ratio indicating that it is able to generate more sales from its assets and therefore ends up with a higher return on its assets.
Summary of Ratio Analysis with the DuPont Model
In this chapter, we first looked at what is the primary objective of a company. We then evaluated if the company is achieving its primary objective by computing its return on equity. We dug further to understand why this company’s return on equity is higher or lower than other similar companies by breaking down the return on equity into two components: the return on assets and its leverage ratio. Having understood a company’s return on assets ratio, we looked at the two components of the return on assets ratio: the profit margin and asset turnover ratios. By evaluating these ratios we are able to address the following questions.
- Is a company achieving its primary objective?
- What is the return provided to investors and how is it calculated?
- How is this company able to provide this return to its shareholders?
- How efficiently is it managing its assets?
- Has the company leveraged debt to boost its return to shareholders?
- Does the company rely on a profit margin to generate returns to equity or does it rely on generating more sales volume?
Next Steps: Now that you have a good understanding of what is in a cash flow statement and how to read a cash flow statement in a company’s annual report, why don’t you head over to either:
- Learn how to read an income statement;
- Learn how to read a balance Sheet;
- Learn how to read a cash flow statement; or
- Learn how to create and read a percentage statement.
If you have questions or need help with figuring out a cash flow statement, feel free to call our accounting or finance teams and we will be happy to assist you.