If I were to ask how one company is different from another company or its competitors, I might be given a variety of answers focusing on its products, target segments, culture, scope, business model, etc.
Percentage Statements
The percentage statements are probably the best way to quickly understand a company’s business model and how it is different from other companies. By looking at the company’s percentage statements, I can understand how one company or industry is different from its others from a financial and business model perspective.
Reading the percentage statements also helps me understand many other aspects of the business. Reviewing a company’s percentage statements will help me answer the following questions:
- How is this company different from other companies or its competitors?
- Has the company’s financial performance improved or worsened and why?
- What are the main components of expenses for this company?
- How does the strategy of this company impact its financial performance? Is the company’s strategy working?
- What is the financial health of this company?
The percentage income statement and percentage balance sheet are prepared from the income statement and the balance sheet respectively. As the name suggests, the components of the percentage statement are not mentioned in dollar terms but in terms of a percentage of another variable. The main advantage of percentage statements is that they can be used to compare companies of different sizes.
Percentage Income Statement
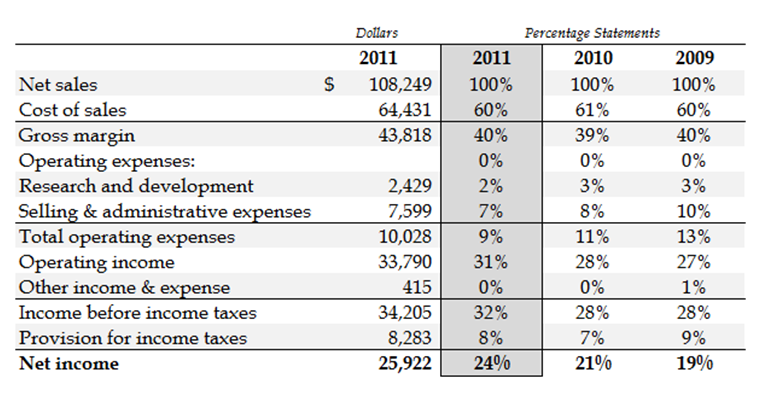
The percentage income statement is prepared by expressing each component of the income statement as a percentage of the net sales or revenues of the company. For example, Apple’s 2011 net sales was $108.25 million, and its cost of sales was $64.43 million. So the cost of sales as a percentage of net sales will be $64.43/$108.25 or 60%. Its gross margin in 2011 was $43.82 million or 40% ($43.82/$108.25).
Components Of Expenses
A mere glance at this percentage statement for the year 2011 will help us to understand what the key cost components for the company were and how profitable its operations were.
A look at Apple’s percentage income statement will reveal some interesting observations. The cost of its goods sold is approximately 60%. This indicates that for every dollar earned, it spent only 60 cents in making its products, leaving a healthy 40 cents to cover other costs and profits. We can also see that it spends about 2-3% of each dollar earned on research and development. Apple also spends about 7-10% of its revenues on sales and other general expenses. What do you notice after looking at the percentage statements of Google, Wal-Mart, and American Airlines? Have these companies spent more of their revenues on research and development or on sales and other general expenses? What does this say about where they focus their time, energy, and money?
Trends over time
The percentage statement also helps the reader observe trends over time. We can see if the company’s profit margins have been improving or if its costs have been increasing over time, etc. In the case of Apple, we can see that Apple’s operating margin has been increasing over the last few years. What is causing the increase in operating margins? This could be because of the decreasing proportion of spend on selling and general administrative expenses as a result of its increasing sales. What trends do you notice after looking at the percentage statements of Google, Wal-Mart, and American Airlines?
Understand The Nature Of Business
Percentage statements help us understand the nature of different types of businesses. For example, some businesses are high-margin businesses, whereas some are low-margin high turnover businesses. Some companies intentionally invest in research & development while some companies do not. Percentage statements help us understand the differences between companies and business patterns. Let’s look at the percentage statements of Apple, Microsoft, and Wal-Mart.
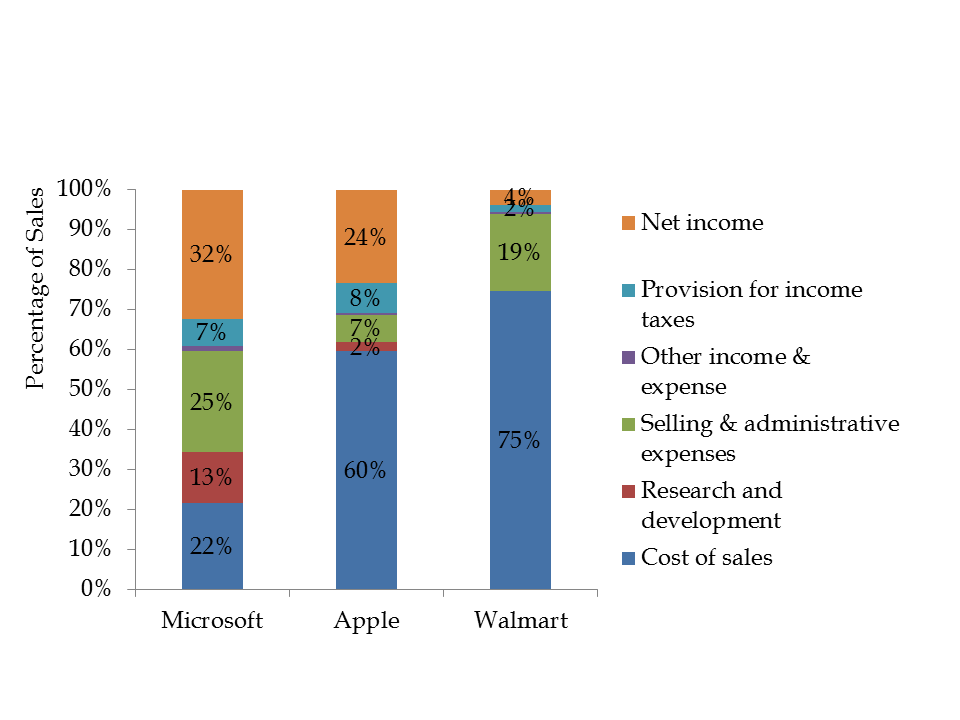
We can see striking differences in the way Apple operates when compared to Microsoft, a company that is similar in many ways, or Wal-Mart, a company that is in an entirely different business. The cost of goods sold highlights the most obvious difference. Wal-Mart is a retailer, and therefore its cost of goods sold is expected to be a significant part of its costs. Apple sells hardware and software, so has a lower cost of goods percentage when compared to Wal-Mart. Microsoft mostly sells software, and so has a lower cost of goods sold than Apple. We can see that Wal-Mart invests nothing in research and development, and Microsoft invests a significant amount in research and development.
A company’s strategy can also be observed in its percentage statements. For example, Wal-Mart’s strategy is to be a low price – high volume business, and this will be reflected in its sales revenues and profit margins. These percentages will be different for a company like Neiman Marcus, whose strategy is to be a high-margin low volume business. If a company has changed its strategy over time, we will see that reflected in the financial statements too. If two companies are in the same business and adopt similar strategies, their percentage income statement will show which of the companies ran its operations more efficiently.
Percentage Balance Sheet
The percentage income statement, like the percentage balance sheet, is helpful to understand the nature of the company and its business. It is prepared by expressing each component as a percentage of the total assets of the company. A comparison of the figures for the past few years will give us insights into how the company’s strategy has played out or changed over the years.
You will see striking differences in the businesses of Apple, Microsoft, and Wal-Mart when you look at the percentage balance sheets of these companies.
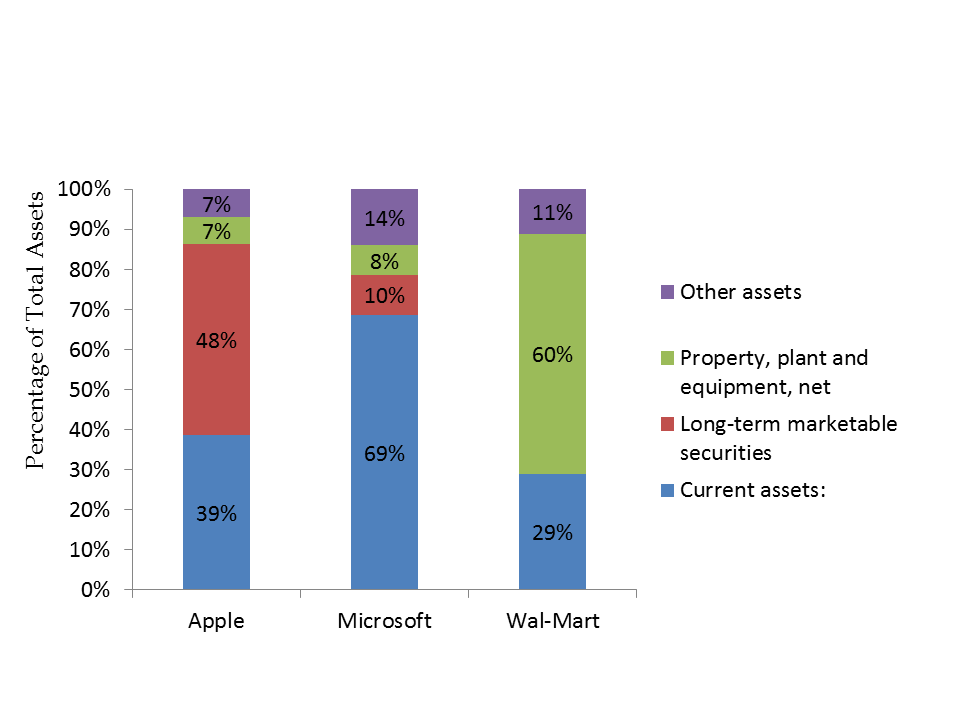
You will notice that Wal-Mart has 60% of its assets in property, plant, and equipment, whereas Apple and Microsoft have far fewer assets in this category. This reflects the differences in their business models. Wal-Mart requires land and building space throughout the country to run its retail outlets. Apple and Microsoft do not require the kind of footprint Wal-Mart requires. Similarly, Apple and Microsoft have less than 1% of their assets in inventories, whereas Wal-Mart has 20% in inventories, reflecting the investments in merchandise Wal-Mart needs to run its business.
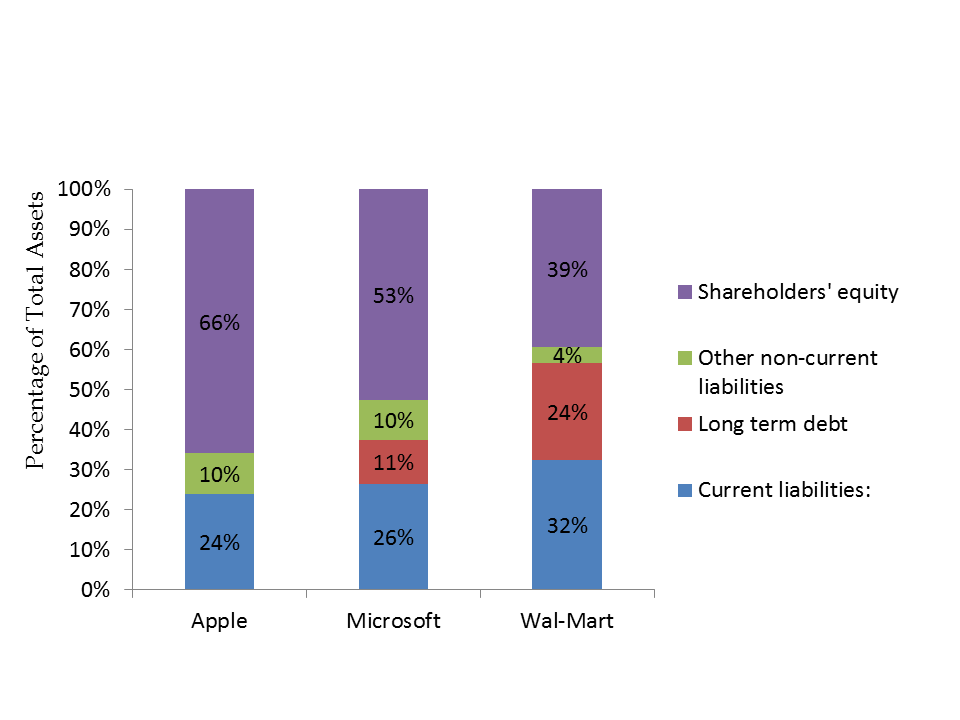
If you observe the percentage balance sheets of Apple, Microsoft, and Wal-Mart, you will see that Apple has no debt, Microsoft operates on little debt, and Wal-Mart uses a reasonable amount of debt. You will also see that these three companies have had healthy profits over the last few years, causing their shareholders’ equity to be a large portion of their liabilities with Apple having the largest proportion in shareholders’ equity.
Summary of the Percentage Statements
Reviewing a company’s percentage statements will help me answer the following questions:
- How is this company different from another company or its competitors?
- Has the company’s financial performance improved or worsened? Why?
- How does the strategy of this company impact its financial performance? Is the company’s strategy working?
Application of the Percentage Statements
Here are some Harvard Business School Case Studies that help you apply your understanding of percentage statements.
- Corporate Financial Ratio Insights in a Department of Defense Context by Mark E. Haskins (Product #: UV7763-PDF-ENG)
- Remington, Inc.: Instant Insights for Financial Ratios by Mark E. Haskins (Product #: UV1737-PDF-ENG)
- Financial Ratio Analysis by Richard H. Mimick (Product #: 85K031-PDF-ENG)
- The Game of Financial Ratios by Pooja Gupta, Madhvi Sethi, Darroch A. Robertson (Product #: W17015-PDF-ENG)
Next Steps: Now that you have a good understanding of what is in a cash flow statement and how to read a cash flow statement in a company’s annual report, why don’t you head over to either:
- Learn how to read an income statement;
- Learn how to read a balance Sheet; or
- Learn how to read a cash flow statement.
If you are looking to build or model financial statements in Microsoft Excel, look no further than our collection of books here.
- Modeling Projected Financial Statements (Without a Plug!);
- Modeling Leveraged Buyouts – Simplified!;
- The ABCs of DCF Valuation and Modeling;
- 101 Private Equity & Investment Banking Interview Questions & Answers.
If you have questions or need help with figuring out a cash flow statement, feel free to call our accounting or finance teams and we will be happy to assist you.