One topic that confuses MBAs, CPAs, and CFAs students learning statistics is the use of the Norm.Dist and Norm.Inv Microsoft Excel functions. In this article, we help students understand the use of Norm.Dist and Norm.Inv Microsoft Excel functions.
Norm.Dist and Norm.Inv functions: Not Siblings But Yin & Yang

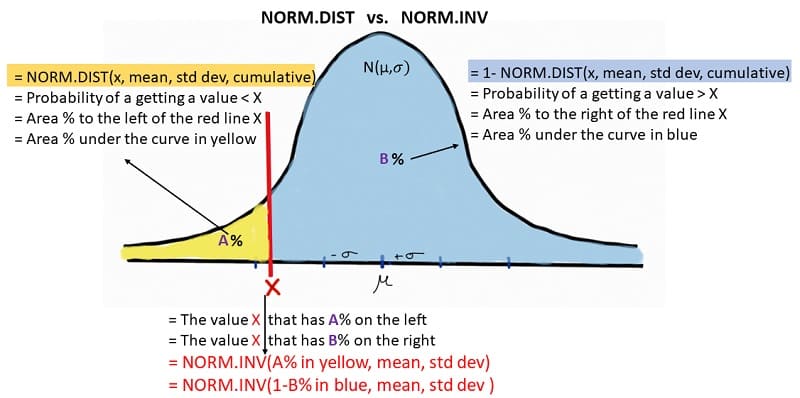
Think of the Norm.Dist and Norm.Inv Microsoft Excel functions, not as siblings but like the yin and yang: inseparable but opposites. The relationship between the Norm.Dist and Norm.Inv Microsoft Excel functions are akin to darkness and light. Or like opposite sides of the same coin! Like the yin and yang, one, Norm.Dist uses the X value to get the P value, and the other, Norm.Inv, uses the P value to get the X value! (note that the X value is the Z value on a standard normal curve)
When do you use the Norm.Dist and Norm.Inv Microsoft Excel & Google Spreadsheets functions?
To be specific, Norm.Dist and Norm.Inv Microsoft Excel functions are used as follows.
- Norm.Dist is used when you want to find the probability of finding a value less than or equal to X. The inverse of the Norm.Dist is also useful. 1 – Norm.Dist is used when you want to find the probability of finding a MORE than or equal to X.
- Norm.Inv is used when you are given the probability on the left side and want to find what value of X reflects that probability.
Another way to think about the Norm.Dist vs. Norm.Inv Microsoft Excel functions is as follows.
- NORM.DIST(X, mu, standard deviation, cumulative) returns probability (‘p’) or the area under the normal curve N(mu, standard deviation) to the left of a value X on the horizontal axis.
- NORM.INV(p, mu, standard deviation, cumulative) returns the value X that has probability (‘p’) or the area under the normal curve N(mu, standard deviation) to the left.
Please pick whatever makes the most sense to you.
Norm.Dist and Norm.Inv Syntax
The syntax for the Norm.Dist and Norm.Inv functions are as follows:
- NORM.DIST(X, mu, standard deviation, cumulative)
- NORM.INV(p, mu, standard deviation)
Where :
- X: The value for which you want the area to the left in a normal distribution.
- Mean: The arithmetic mean of the normal distribution.
- Standard deviation: The standard deviation of the normal distribution. Note that standard deviation is also referred to as sigma.
- Cumulative: Use TRUE if you are looking for the cumulative distribution function. Use FALSE, if you are looking for the probability density function. (read more on the difference between the cumulative distribution function and the probability density function)
You will also be pleasantly surprised to know that the Norm.Dist and Norm.Inv syntax is exactly the same in Microsoft Excel and Google Spreadsheets. Here are instructions in Microsoft Excel. Norm.inv and Normdist on Google Spreadsheets.
Norm.Dist and Norm.Inv vs. NormDist and NormInv
Some students are bothered by the difference between Norm.Dist and Norm.Inv vs. NormDist and Norminv. Please note that the NormDist and Norminv are older formulas.
- NormDist –> Norm.Dist; and
- Norminv –> Norm.Inv
Learn Norm.Dist and Norm.Inv Microsoft Excel functions with an example.
As statistics tutors, we believe the best way to learn Norm.Dist and Normal.Inv Microsoft Excel functions is by applying it to a real example.
Let us assume that the daily demand for ice cream follows a normal distribution with a mean of 250 and a standard deviation of 50.
What is the probability of demand on a day being less than 200 ice creams? What is the chance of demand being less than 200 ice creams?
We tutor students to draw out their understanding of the data and the question for clarity. So on this question, the normal distribution will have a mean of 250 ice creams with a standard deviation of 50 ice creams. The question asks us what is the probability of demand on a day being less than 200 ice creams. This implies the variable of interest X is 200 ice creams. Therefore, the variable of interest is the area to the left of X.
Since we are given the value of X and want to find the area under the normal curve to the left of the X value, we use the NORM.DIST(X, mu, standard deviation, cumulative) function. We fill in the values for X, Mu and standard deviation or sigma =NORM.DIST(200,250,50,TRUE). Microsoft Excel will give us a value of 15.87%. This tells us that the probability or chance of the daily demand for ice cream being less than 200 is 15.87%.
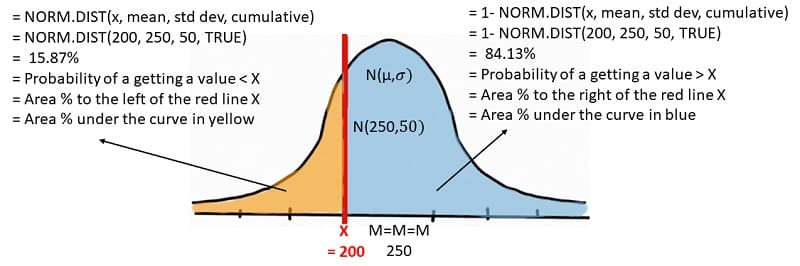
What is the probability of demand on a day being MORE than 200 ice creams?
Continuing with the above normal distribution diagram, we know that the area of interest is to the right of the 200 mark. Since the entire area under the curve will be 100%, we can simply subtract 15.87% from 100% to arrive at 84.13%.
Or we can use the 1 – NORM.DIST(X, mu, standard deviation, cumulative) function. We fill in the values for X, Mu, and standard deviation or sigma = 1 – NORM.DIST(200,250,50,TRUE). Microsoft Excel will give us a value of 84.13%. This tells us that the probability or chance of the daily demand for ice cream being MORE than 200 is 84.13%.
This implies that if we stock only 200 ice creams on a given day, there is an 84.13% probability that we will run out of stock. This brings us to the next question.
What quantity must we stock so that there is only a 10% chance we will run out of stock? Or in other words, what quantity must we stock so that we meet demand 90% of the time?
In this situation, we know the probability under the curve (on both sides), but we do not know the X value. Norm.Inv is used when you are given the probability to the left and want to find what value of X reflects that probability. As earlier, we encourage students to draw out their understanding of the data and the question for clarity.
Since we know we want to meet demand 90% of the time, we have the X value at the point that has 90% of the area under the curve on the left. This leaves only 10% on the right indicating if we order X, we will be out of stock only 10% of the time.
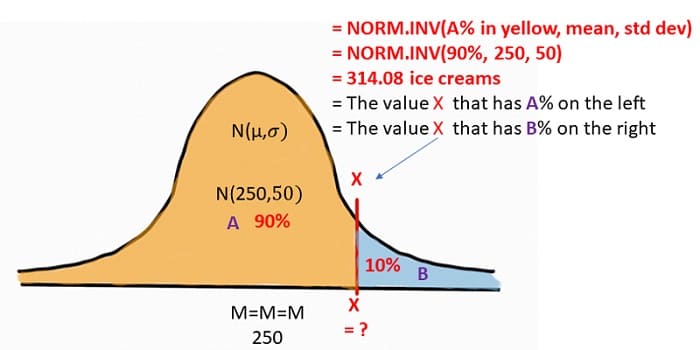
Since we are given the probability to the left and want to find what value of X reflects that probability, we use the NORM.INV(p, mu, standard deviation) function. We fill in the values for X, Mu, and standard deviation or sigma =NORM.INV(90%,250,50). Microsoft Excel will give us a value of 318.08. This tells us that if we stock 318.08 ice creams, the probability or chance of running out of stock is only 10%. In other words, we will meet demand 90% of the time!
Statistics Tutoring
We hope this gives you clarity on when to use the Norm.Dist spreadsheet function vs. Norm.Inv spreadsheet function? We teach statistics to MBAs, CPAs and CFAs. One of the first statistical concepts students encounter when learning statistics is the normal distribution. Understanding distributions, sampling, central limit theorem, normal distribution, etc. is not complicated but it is important. Our MBA tutors can assist you with graduate-level statistics tutoring. Feel free to call or email if we can be of assistance with tutoring.