Data analytics and artificial intelligence are becoming more critical to business as data becomes more abundant and accessible. So business schools and MBA programs are putting more courses around statistics, data analysis, and artificial intelligence into their programs. One topic that most MBA students encounter is clustering. We provide MBA/graduate-level tutoring in most quantitative courses, including tutoring students clustering. This article discusses three different approaches to clustering and related issues.
- What is Clustering?
- Applications of Clustering
- One method? Different Approaches to Clustering
- What is Hierarchical Clustering?
- Advantages and Disadvantages of Hierarchical Clustering
- What is Density Based Clustering?
- Advantages and Disadvantages of Density Based Clustering
- What is K-means Clustering?
- Step by Step approach to Implement K-Means Clustering
- Elbow Point to Determine K
- Silhouette Coefficient Metric to Determine K
- Advantages and Disadvantages of K-Means Clustering
- Difference between K-Means and K-Nearest Neighbors (KNN)
- Graduate Level Tutoring for Clustering
What is Clustering?
A cluster is defined as “a group of similar things or people positioned or occurring closely together”. So clustering is the act of grouping similar things, people, documents, etc. Clustering is choosing similar objects based on a host of criteria and properties.
Applications of Clustering
Clustering is used in a variety of industries and situations. Some examples include:
- Search engine algorithms use clustering to find websites similar to the search term.
- Plagiarism tools use clustering to find copycat content.
- Detecting cancerous cells from various medical imagery.
- Recommendation engines such as those used by Netflix, Spotify, Amazon, etc, use clustering to find similar movies, songs, or products for its users.
- Image recognition.
- Job search portals such as Linkedin and Indeed use clustering to identify jobs for job hunters and candidates for recruiters.
- Advertising and marketing uses clustering for segmentation and targeting of advertisements.
- Spam detection in email service providers uses clustering techniques.
One Method? OR Different Approaches to Clustering?
There are various approaches to selecting clusters or clustering! We discuss the three methods listed below.
- Hierarchical,
- Density-based, and
- Partitional clustering.
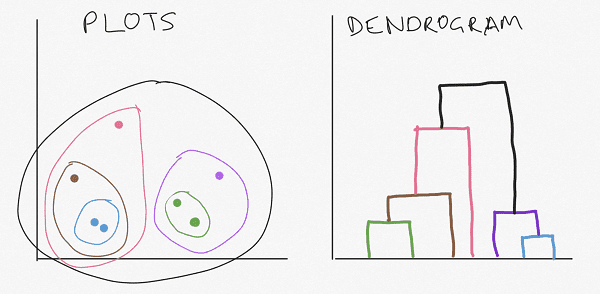
What is Hierarchical Clustering?
Hierarchy is order. So you can cluster by ordering into groups sequentially. In hierarchical clustering, you group at different levels or hierarchies. The topmost has everyone into one group and the bottommost hierarchy has everyone in individual groups. Hierarchical clustering can be done bottoms-up or a top-down:
- The bottoms-up hierarchical clustering approach is also referred to as agglomerative clustering. Agglomerative clustering starts by merging the two most similar plots. Then it proceeds to the next most similar three points. This continues till we end with one large cluster.
- The top-down hierarchical clustering approach is also referred to as divisive clustering. Divisive clustering starts with one cluster that has all the plots. The second step in divisive clustering is to break up this large cluster into two based on similarity. This continues till we end with single data plots in each cluster.
Advantages and Disadvantages of Hierarchical Clustering
Pros of Hierarchical Clustering:
- Hierarchical clustering is a deterministic process unlike some other clustering techniques.
- Hierarchical clustering shows you new relationships between plots; and
- Hierarchical clustering gives you readable dendrograms.
Cons of Hierarchical Clustering
- Hierarchical clustering requires heavy-duty computations
- Hierarchical clustering can get complex; and
- Hierarchical clustering is sensitive to outliers.
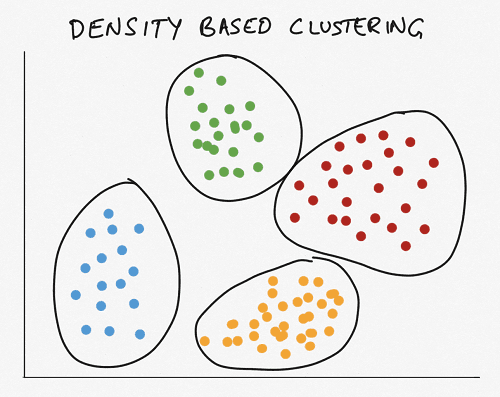
What is Density-Based Clustering?
In density-based clustering, groups or clusters are created where you have a high density of data points. This can also be done based on low-density spaces as separators. Ideally, both high-density areas and low-density spaces are considered in selecting clusters.
When using the density-based clustering approach, the number of clusters is arrived at automatically based on the data, unlike other clustering methods where you have to specify the number of clusters initially.
Advantages and Disadvantages of Density-Based Clustering
Pros of Density-Based Clustering
- Density-based clustering allows clusters to have varying shapes and sizes.
- Density-based clustering is not highly influenced by outliers.
Cons of Density-Based Clustering
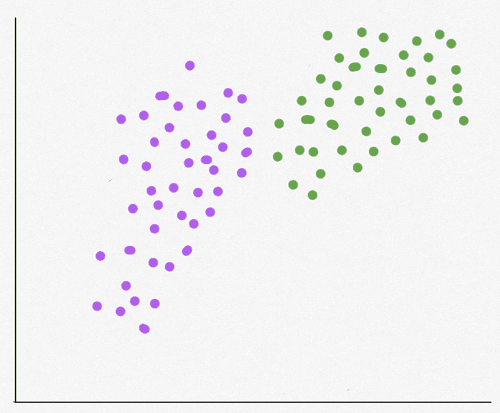
- Density-based clustering is not ideal for spaced-out data plots; and
- Density-based clustering assumes similar density in clusters which may not be true.
What is K-Means Clustering?
The K-means approach starts by determining k clusters to assign plots to. Each cluster has a centroid. The centroid is the central point of the cluster. This of a centroid as the mean of the cluster. The centroid is the central location and does not have to be a fundamental point in the cluster. All the plots are assigned to different clusters based on proximity to cluster centroids. This ensures that data plots in a cluster are similar (intra-class similarity). It, therefore, leads to higher dissimilarity between clusters (inter-class similarity).
The centroids are continuously adjusted to minimize intra-class similarity and maximize inter-class similarity.
Step by Step approach to Implement K-Means Clustering
- Determine the number of clusters – k
- Select a centroid for each cluster or k centroids (one for each k clusters).
- Assigns every data plot to the nearest centroid
- For every cluster, compute the NEW centroid. The NEW centroid is the average of all plots of that cluster. This results in minimizing intra-cluster distance.
- Reassign every data plot to the nearest NEW centroid
- For every NEW cluster, recompute another centroid.
- Repeat until intra-class similarity is minimized or the centroid does not change or you have reached a preset number of iterations.
Remember that intra-class similarity is the sum of distances between the data points and their corresponding centroid.
Elbow Point to determine K
Notice that we needed to determine the number of clusters to get started with the K-means clustering approach. How do we determine the number of clusters to start with when we are using the k-means approach? The elbow joint is a method to help determine the number of clusters to start within k-means Clustering.
To evaluate the strength of clusters, we compute the Sum of Squared Errors Within Clusters (WCSSE). The lower the Sum of Squared Errors Within Clusters (WCSSE) the more tightly packed the cluster.
We compute the WCSSE for different Ks or the different number of clusters. The larger the cluster number, the lower the Sum of Squared Errors Within Clusters (WCSSE). So you plot the WCSSE on a plot for different Ks.
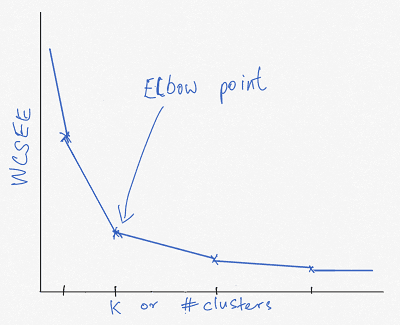
The optimal number of clusters or “K” is the point at which the WCSSE increases only slightly for each additional K. This K is known as the “elbow point” because it the WCSSE line starts to flatten out.
Silhouette Coefficient Metric to Determine K
You already noticed that we needed to determine the number of clusters to get started with the K-means clustering approach. We saw above that we can use the eblow method to determine the number of clusters to start with when we are using the k-means approach? The silhouette coefficient is another method used separately or along with the elbow point to help determine the number of clusters to start within k-means Clustering.
The silhouette coefficient measures cluster cohesion and separation. The silhouette coefficient measures how well a data plots fit in its cluster-based on:
- Intra-cluster distance: Distance between points in a cluster
- Inter-cluster distance: Distance between points in a cluster with points in other clusters
The silhouette coefficient ranges between -1 and 1. A silhouette coefficient that is positive indicates good and effective clustering. In contrast, negative values indicate poor and ineffective clustering.
Advantages and Disadvantages of K-Means Clustering
Pros of K-means clustering
- K-means clustering can be scaled for use with large data sets.
- K-means clustering is simple to implement.
- K-means clustering is deterministic.
- K-means clustering allows you to start with educated guesses on the positions of centroids to speed up the process.
- K-means clustering can be adapted to new data points; and
- K-means clustering can have clusters of different shapes and sizes.
Cons of K-means clustering
- In K-means clustering, you need to to define the number of clusters manually.
- Clusters are highly dependent on initial values.
- K-means is very sensitive to outliers, since centroids can be dragged in the presence of noisy data.
Difference between K-Means and K-Nearest Neighbors (KNN)
K-means falls in the unsupervised machine learning category of data analytics techniques. The data does not have labels in unsupervised machine learning. The technique looks for similarities in the data plots and clusters them. K-means is clustering or partitioning plots into K clusters. It results in clusters where points in each cluster are close together ideally.
K-nearest neighbors, on the other hand, falls in the supervised machine learning category of data analysis techniques. The data had labels in supervised machine learning. There is also any variable or output variable that we are trying to understand. K-nearest neighbors is a classification or regression technique. K-nearest neighbors data have labels. The K-nearest neighbors method uses the classification of other data points to decide the classification of the plot of interest.
K-nearest neighbors you can use any of the following methods to determine the distance between points.
- Euclidean Distance: Euclidean distance is calculated as the square root of the sum of the squared differences between a new point (x) and an existing point (y).
- Manhattan Distance: This is the distance between real vectors using the sum of their absolute difference
- Hamming Distance: It is used for categorical variables. If the value (x) and the value (y) are the same, the distance D will be equal to 0—otherwise D=1.
Graduate Level Tutoring for Clustering
Graduatetutor.com’s graduate-level tutors can provide you with private tutoring for clustering or K-nearest neighbors using the techniques described above. Please email or call us or sign up using the form below.