Regression analysis is one of multiple data analysis techniques used in business and social sciences. The regression analysis technique is built on many statistical concepts, including sampling, probability, correlation, distributions, central limit theorem, confidence intervals, z-scores, t-scores, hypothesis testing, and more. However, you may not have studied these concepts. And if you did study these concepts, you may not remember all the statistical concepts underlying regression analysis. The ‘Interpreting Regression Output Without all the Statistics Theory’ book is for you to read and interpret regression analysis data without knowing all the underlying statistical concepts.
Who is this book for?
This book is primarily written for graduate or undergraduate business or humanities students interested in understanding and interpreting regression analysis output tables. This book is also helpful for executives and professionals interested in interpreting and using regression analysis. It is a wonderful resource for students or professionals looking for a quick refresher before exams or interviewing for jobs in the data analysis industry.
This book is not intended to replace a statistics textbook or be a complete regression analysis guide. Instead, it is intended to be a quick and easy-to-follow summary of the regression analysis output. ‘Interpreting Regression Output Without all the Statistics Theory’ focuses only on basic insights the regression output gives you.
This book does not assume that the reader is familiar with statistical concepts underlying regression analysis. For example, the reader is not expected to know the central limit theorem or hypothesis testing process. In addition, the reader is NOT expected to be an expert in Microsoft Excel, R, Python, or any other software that may perform a regression analysis.
This book is not intended to replace a statistics text book or to be a complete guide to regression analysis.
Interpreting Regression Output Without all the Statistics Theory is based on Senith Mathews’ experience tutoring students and executives in statistics and data analysis over 10 years.
5 Chapters on Regression Basics
The first chapter of this book shows you what the regression output looks like in different software tools.
The second chapter of Interpreting Regression Output Without all the Statistics Theory helps you get a high-level overview of the regression model. You will understand how ‘good’ or reliable the model is. The second chapter helps you address the following questions:
- What does the the Multiple R tell me about the relationships between the X and Y variables?
- R-Squared or Multiple R-Squared tell me about the regression model?
- How is the Adjusted R-Squared different from the R-Squared?
- How is the standard Error useful?
- What does the Significance F tell me about the regression model?
The third chapter of Interpreting Regression Output Without all the Statistics Theory discusses the regression equation and helps you find the ingredients of the regression equation. This chapter helps you address the following questions:
- What is the regression equation?
- Where can I get the ingredients of the regression equation?
- What does the regression equation tell me?
- What does the intercept indicate?
- What do the coefficients indicate?
- What do the signs of coefficients indicate?
The fourth chapter of this book digs deeper into the regression equation. It helps you interpret the equation and understand its components. The fourth chapter of Interpreting Regression Output Without all the Statistics Theory helps you address the following questions:
- How do I interpret the Standard Error of the coefficients for each variable in a regression output?
- How is the t-statistic or the t-value computed and what does it indicate?
- How can I interpret the P-values in a regression model?
- What does the 95% Confidence Interval for each variable indicate?
The fifth chapter addresses important points you must keep in mind when using regression analysis. It includes a brief discussion on some of the following aspects given regression analysis:
- Causation vs Correlation
- Man with a hammer syndrome
- Do outliers impact regression output?
- Underlying Assumptions of regression analysis
Enjoy reading this book. Should you need more assistance with interpreting regression analysis output, please do not hesitate to call us or send us an email. One of our statistics tutors will be more than happy to assist you with interpreting your regression analysis output.
Regression Data Used
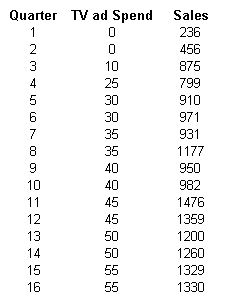
Should you need assistance with interpreting regression analysis output, please do not hesitate to call us or send us an email.
Chapter 1: Sources & Types of Regression Output
Regression analysis can be performed on a variety of software today. The ubiquitous Microsoft Excel is still by far the most popular tool. A variety of other free and paid tools are available to run regression analysis. Some of these include SPSS, SAS, R, Python and JMP, etc.
Each of these tools presents the regression analysis output data in different ways. However, all of these tools provide essentially the same data. We present below the regression output from some of the tools mentioned above.
Please feel free to play with it live and see the impact it has on the regression equation and the corresponding chart.
1.1 Microsoft Excel Output

1.2 R Programming Output

Note that the regression analysis output provides essentially the same information in all these cases, although it is presented in different formats or designs.
Every number in the regression output indicates something. We will address only the most frequently used numbers in this book.
Chapter 2: The Big Picture / Understanding the Model
The first set of numbers my eyes wander to are at the top of the regression output in Microsoft Excel under the heading Regression Statistics.

This data is presented in the last few rows of the regression output in R. This set of data gives you the big picture about your regression output. It allows you to answer questions such as: How good is your model? What percentage of the variation is explained by the variables included?
2.1 The Multiple R
The multiple R is the absolute value of the correlation coefficient of the two variables (X and Y) being evaluated. The correlation coefficient indicates how closely two variables move in tandem with each other. It assumes that the relationship is linear and so measures the linear relationship between the two variables X and Y.
The correlation coefficient has a value between +1 and −1. A correlation coefficient of +1 indicates that the variables move in perfect tandem and in the same direction. A correlation coefficient of 0 indicates that there is no relationship between the variables. A correlation coefficient of −1 indicates that the variables move in perfect tandem but in the OPPOSITE direction.
However, since the multiple R is the absolute value of the correlation coefficient, we do not get to know if the correlation is positive or negative! This means that we do not see the direction of the relationship and only know the strength of the relationship.
The correlation coefficient is also referred to as the Pearson correlation coefficient or Pearson’s r.
The Multiple R in our example indicates a strong correlation between the amount spent on TV ads and sales. As indicated above, the Multiple R will not tell us if the correlation is positive or negative.
2.2 R-Squared or Multiple R-Squared
The R-Squared (in Microsoft Excel) or Multiple R-Squared (in R) indicates how well the model or regression line “fits” the data. It indicates the proportion of variance in the dependent variable (Y) explained by the independent variable (X).
We know a variable could be impacted by one or more factors. Therefore, the R-Squared indicates the percentage of variation in the dependent variable explained by the independent variables.
In our example, we know that the unit sales of a product will be influenced by various factors such as price, competitors’ actions, economy, etc., and not just by the advertisement expenditure. When we run a regression with sales as the dependent Y variable and only advertisement expenditure as the independent X variable, the R-square indicates the percentage of variation in unit sales explained by the advertisement expenditure. It tells you the percentage of change in sales that is caused by varying the advertisement expenditure. This also means that we can compute the percentage of variation explained by factors other than advertisement expenditure such as the economy, competition, price, etc. The percentage of variation that is explained by factors other than advertisement expenditure will be 100%-R-square.
Our regression output indicates that 81.48% of the variation in unit sales is explained by the advertisement budget. And 18.52% (100%-81.48%) of the variation is caused by factors other than advertisement expenditure.
(Also, note that as the name suggests, the R-square is equal to the square of the multiple R!)
2.3 Adjusted R-Squared
Adjusted R-Squared is used only when analyzing multiple regression output and ignored when analyzing simple linear regression output. When we have more than one independent variable in our analysis, the computation process inflates the R-squared. As the name indicates, the Adjusted R-Squared is the R-Square adjusted for this inflation when performing multiple regression.
The interpretation of the Adjusted R-Squared is similar to the R-square and used only when analyzing multiple regression output.
2.4 The Standard Error
The standard error in the regression output is a very important number to understand when interpreting regression data. The standard error is a measure of the precision of the model. It reflects the average error of the regression model. In other words, if we were using the regression model to predict or estimate the dependent variable or variable of interest, the standard error shows you how wrong you could be if you used the regression model to make predictions. As the standard error reflects how wrong you could be, we want the standard error to be as small as possible.
The standard error is used to help you get a confidence interval for your predicted values.
2.5 Significance F
The simplest way to understand the significance F is to think of it as the probability that our regression model is wrong and needs to be discarded!! The significance F gives you the probability that the model is wrong. We want the significance F or the probability of being wrong to be as small as possible.
Significance F: Smaller is better….
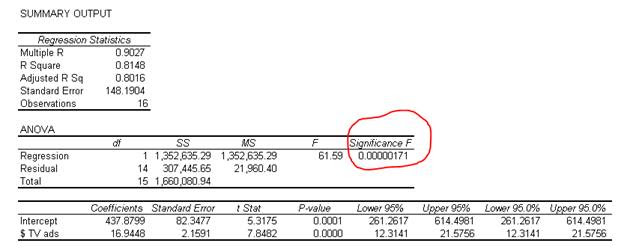
We can see that the Significance F is very small in our example. We usually establish a significance level and use it as the cutoff point in evaluating the model. Commonly used significance levels are 1%, 5%, or 10%. In this example, the Significance F is smaller than any of the commonly used significance levels.
Statistically speaking, the significance F is the probability that the null hypothesis in our regression model cannot be rejected. In other words, it indicates the probability that all the coefficients in our regression output are actually zero! The significance F is computed from the F value (found to the left of the significance F in Microsoft Excel’s output). The F value is a value similar to the z value, t value, etc. It is a ratio computed by dividing the mean regression sum of squares by the mean error sum of squares. The F value ranges from zero to a very large number.
Note that the significance F is similar in interpretation to the P-value discussed later in a later section. The key difference is that the significance F applies to the entire model as a whole, whereas the P value will be applied only to each corresponding coefficient.
Chapter 3: The Regression Equation or Model
The regression equation or model is the heart of any regression analysis. Since the primary purpose of this booklet is to teach you how to understand and interpret the regression analysis output, we jump right into the regression equation or model.
3.1 What is the regression equation?
Remember, in regression analysis; your objective is to figure out the relationship between the variables being analyzed. One way to express the relationship between the variables is in the form of a mathematical expression. In simple linear regression, we assume that the relationship is linear or, in other words, is a straight line. The mathematical expression of a straight line is:
Y = a + bX
In this equation:
- Y is the variable we are trying to predict. It is called the dependent variable because we are assuming that Y is dependent on the X variable (the ‘independent’ variable).
- X is called the independent variable because we assume it is not dependent on Y. It is also called the explanatory variable because it is supposed to “explain” what causes changes in Y.
- b is the slope of the regression line. The slope reflects how large or small the change in Y will be for a unit change in X.
- a is the intercept or the point at which the regression line will intercept the Y-axis.
3.2 Where can I get the ingredients of the regression equation?
The values of a and b form the heart of the regression model. The values of a and b are found as the coefficients in any regression output.

X and Y are variables and will take on different values at different points in time. The values of a and b are substituted in the regression equation to get the relationship between X and Y as follows:
Y = 437.88 + 16.95*X
This can also be expressed in the context of the example or question making the relationship more meaningful.
Sales = 437.88 + 16.95*Advertising budget
3.3 What does the regression equation tell me?
What this regression model indicates is that sales are dependent on the advertising budget.
If I spend $1 on advertising, I can expect to have sales of $454.83 (Sales = 437.88 + 16.95*$1)
If I spend $2 on advertising, I can expect to have sales of $471.78 (Sales = 437.88 + 16.95*$2)
If I spend $3 on advertising, I can expect to have sales of $488.73 (Sales = 437.88 + 16.95*$3)
3.4 What does the intercept indicate?
The intercept of 437.88 indicates that sales will be 437.88 if we do not spend any money on advertising. This is because when advertising spend is zero, it (zero) is multiplied by the slope or b (here 16.95), resulting in a zero. This is added to your intercept, leaving you only the intercept value 437.88.
If I spend $0 on advertising, I can expect to have sales of $437.88 (Sales = 437.88 + 16.95*$0)
3.5 What do the coefficients indicate?
The coefficient b (here 16.95) indicates that for every unit increase in the X variable (here TV spend), the Y variable (here sales) will change by the amount of the coefficient 16.95. It is also referred to as the slope of the line in a simple linear equation.
3.6 What do the signs of coefficients indicate?
If the coefficient of the independent variable X is positive, it indicates for every unit increase in the independent variable; the dependent variable will increase by the value of the coefficient. This also means that for every unit decrease in the independent variable, the dependent variable will decrease by the value of the coefficient.
On the other hand, if the coefficient of the independent variable X is negative, for every unit increase in the independent variable, the dependent variable will decrease by the value of the coefficient. Correspondingly, for every unit decrease in the independent variable, the dependent variable will increase by the value of the coefficient.
In our example, the sign of coefficient b is positive (here, it is +16.95). Therefore for every $1 increase in TV spend, sales can be expected to increase by $16.95 (the value of the coefficient).
We have only one independent variable in this example. Since you have only one independent variable, it is called simple linear regression. When you have more than one independent variable, it will be called multiple regression. Therefore, you will see a coefficient for every independent variable in the multiple regression output. The interpretation of these coefficients will be the same.
Chapter 4: More on the Regression Equation
In the previous chapter, we understood the regression equation and how good or reliable the regression is. We also learned how to find the intercept and coefficients of the regression equation.
In this chapter, we will look more deeply into the components of the regression equation.
4.1 Standard Error of the coefficients
The standard error of the coefficients reflects the variability of the coefficient. It reflects the average error of the regression model. In other words, when we use the regression model to estimate the coefficient of an independent variable, the standard error shows you how wrong the estimated coefficient could be if you use it to make predictions. Again, because the standard error reflects how wrong you could be, we want the standard error to be small in relation to its coefficient.
The standard error is used to help you get a confidence interval for your coefficient values. This is discussed further in section __.
We notice that the standard error of our variable 2.16 is small relative to its coefficient of 16.95.
4.2 t-statistic or the t-value
The t value or t statistic is not a number we recommend you focus on. It is computed by dividing the coefficient by its standard error and is hard to interpret on its own. If you think about a coefficient and its standard error, you will see that the larger the coefficient is compared to its standard error, the more reliable it will be. This will indicate that the larger the t value, the more reliable the coefficient.
While the t value is not very helpful by itself, it is needed to compute a handy number – the P-value. The t value is used to look up the Student’s t distribution to determine the P-value. The Student’s t distribution shows you how the mean will behave given the size of your sample. The P-value is a really important and useful number and will be discussed next.
4.3 P-values
The P-value indicates the probability that the estimated coefficient is wrong or unreliable. The best way to understand the P-value is as the “probability of an error.” We want the P-value to be as small as possible.
How small should the P-value be? That depends on a cut-off level that we decide on separately. This cut-off level is called the significance level. The cutoff selected depends on the nature of the data studied and the different error types. The cutoff or significance level is usually 1%, 5%, or 10%. Generally, a cutoff point of 5% is used.
Statistically speaking, the P-value is the probability of obtaining a result as or more extreme than the one you got in a random distribution. In other words, the P-value is the probability that the coefficient of the independent variable in our regression model is not reliable or that the coefficient in our regression output is actually zero! The P-value is computed from the t statistic using the Student’s t distribution table.
You will notice that the P-value of the TV spend variable in our example is very small. We do not see a number after 4 decimals. This indicates that this is a ‘significant variable’ and that the TV spend is likely to impacts sales figures.
Note that the P-value is similar in interpretation to the significance F discussed earlier in this book. The key difference is that the P-value applies to each corresponding coefficient, and the significance F applies to the entire model as a whole.
4.4 The 95% Confidence Interval
The coefficient of the independent variable is an estimate of the impact this variable has on the variable being studied. This is estimated from a sample that was analyzed in our regression analysis. The 95% confidence interval of your coefficient gives you the range within which the real value of the coefficient you are estimating falls in. The 95% Confidence Interval is also shown as Lower 95% & Upper 95% in many packages.
You can be 95% confident that the real, underlying value of the coefficient you are estimating falls somewhere in that 95% confidence interval. So, if the interval does not contain 0, your P-value will be .05 or less.

We can see that the Lower 95% is 12.31 and the Upper 95% is 21.58 in our example. What this indicates is that while we believe that the coefficient for TV ads in our example is 16.95, there is a 95% chance that it could be as low as 12.31 or as high as 21.58. Because this range does not include a zero, we have confidence that the TV ads spend does impact our sales results.
Chapter 5: Things to Remember & Warnings
5.1 Causation vs Correlation
Data analysis using the regression analysis technique only evaluates the relationship between the variables studied. It does not prove causation. In other words, only the correlation aspect is evaluated.
Causation is defined as the act of causing something. Causation occurs when a change in one variable causes a change in the other variable. It is also referred to as a causal relationship.
Causation is neither proved nor evaluated in a regression analysis. Instead, controlled studies where groups are split into two with different treatments are required to prove causation.
5.2 Man with a hammer syndrome
Please remember that regression analysis is only one of the many tools in data analysis. You may fall into the trap highlighted by the old saying, “To the man with only a hammer, every problem looks like a nail.” if you know only regression analysis when analyzing data. Regression analysis is appropriate in many situations but not all data analysis situations.
5.3 Sample
Remember that regression analysis relies on sample data and reflects the relationship of the data in the sample. We assume that the sample reflects the true population, but this need not be so.
5.4 Outliers
Regression analysis is sensitive to outliers. Therefore, the data being analyzed must be scrubbed for outliers.
5.5 Underlying Assumptions
Regression analysis is built on four underlying assumptions. If these assumptions do not hold, the regression analysis will not be reliable.
- Linear relationship
- Multivariate normality
- No or little multicollinearity
- No auto-correlation
- Homoscedasticity
You can learn how to test for the underlying assumptions of linear regression here.
Select Resources on Regression
Here are a few resources that will help you learn more about interpreting regression analysis data.
- Regression Primer from PennState
- More in the F test from the Minitab blog
- Another example on interpreting regression output
- Regression hypothesis and the F value interpretation
Note: When you look at the regression output in R, you will see a summary of the residuals. The interpretation of residuals becomes easy. Bu default, the average of the residuals is zero. The median should not be far from zero, and the minimum and maximum should be roughly equal in absolute value in an ideal scenario.