Hypothesis testing is the act of statistically evaluating a belief or theory. Hypothesis testing is the process of testing your theory using data from the real world obtained either through observation or experiments. Hypothesis testing is the step-by-step process of analyzing empirical data to check if it differs from the expected numbers if the belief or theory you started with was true.
This article walks you through the hypothesis testing concept and lists the process of hypothesis testing step by step.
To illustrate the concept and show you the hypothesis testing process with a example, we evaluate a belief that the companies in the Russell 3000 grow at a rate greater than 10% per year.
Here is a list of subtopics if you want to jump ahead:
- Hypothesis Testing: Step by Step
- Structuring the Hypothesis Test: The Null and Alternate Hypothesis
- The Null Hypothesis
- The Alternate Hypthesis
- Significance level
- Sample Size and Sampling to get the test statistic
- Setting up the Critical Value & Reject Regions
- Computing the Test Statistic
- Comparing the Test Statistic Vs. the Critical Values
- Concluding the Hypothesis Test
- A Hypothesis Test and A Criminal Trial: Similarities
- The Sampling Distribution
- Reject Region in Hypothesis Testing
- Some Facts on the Null Hypothesis
- Some Facts on the Alternate Hypothesis
Hypothesis Testing: Step by Step
If you already know the concept of hypothesis testing concept and you only need to follow the step-by-step process outlined below.
- State the null hypothesis
- State the alternate hypothesis
- Decide on the level of significance
- Choose the sample size
- Determine the statistical technique
- Set up the critical values to identify the reject region and non-reject region
- Collect the data sample and compute sample parameters & Test statistic
- Compare sample/test statistic with critical value/reject or non-reject region.
- Make your conclusion clear.
Structuring the Hypothesis Test: The Null and Alternate Hypothesis
In a hypothesis test, we start with two precise statements. These two statements are assumptions or hypotheses because the truth is unknown at this point. The hypothesis test is ‘evaluating the ‘testing’ the first statement.
These two statements must be mutually exclusive but collectively exhaustive statements. Either one of the statements must be true. But both cannot be true.
The Null Hypothesis
A hypothesis test starts with a hypothesis that you want to test. It is designed as a statement or belief that you are examining. This statement or belief is termed the null hypothesis. The null hypothesis is what the hypothesis test is evaluating.
The Alternate Hypothesis
The opposite of the null hypothesis is called an alternate hypothesis. We are not examining the alternate hypothesis. Instead, the alternate hypothesis is what remains if the null hypothesis is rejected after being examined.
We will talk more about designing the null and alternate hypotheses later. Remember that we place what we want to prove in the alternate hypothesis. And we put the opposite of what we want to prove in the null hypothesis.
To continue our example, we will place what we believe to be true (mean growth rate is great than 10%) in the alternate hypothesis. And the opposite of the alternate hypothesis (mean growth rate is less than or equal to 10%) in the null hypothesis. Accordingly, we will have the following null and alternate hypotheses for our example:
Ho: Mean growth rate <= 10%
Ha: Mean growth rate > 10%
If we reject the null hypothesis, we will be concluding that the alternate hypothesis stands. On the other hand, if the evidence does not provide evidence to reject the null hypothesis, we can only conclude that we cannot reject the null hypothesis. In other words, we have not proven the alternate hypothesis. We conclude that we cannot reject the null hypothesis and therefore make no claim to have proven the alternate hypothesis or our starting theory or belief!
Significance Level
In hypothesis testing, the evidence required is gathered from a sample of the relevant population. Then, the parameter of interest from the sample is computed and referred to as the test statistic. This test statistic informs us about the null hypothesis.
Even if the null hypothesis is true, the test statistic is unlikely to be exactly equal to the parameter of interest of the true population because we are basing our test statistic on a sample of the population! A sample is only an unbiased estimator and not the actual population parameter. However, if the null hypothesis is true, the test statistic is likely to be close to the null hypothesis value, and likely agree with the null hypothesis. How close should it be? Or how far away from the null hypothesis value should the test statistic be before we can conclude that the null hypothesis is not true and “can be rejected”?
This is where the significance level comes into play. The significance level is the level of certainty required to reject the null hypothesis. The most commonly used significance levels are 1%, 5%, or 10% in practice. The significance level should be determined by the type of errors we are willing to tolerate (type 1 or type 2 errors).
We will use a 5% level of significance in our example today.
Significance level helps us determine the point beyond which we say that the null hypothesis is not true and “can be rejected”!
Setting up the Critical Value & Reject Regions
Best practice dictates that the critical value must be set up at the design stage and before the hypothesis test is done. The critical value is based on two factors. 1) the sampling distribution and 2) significance levels.
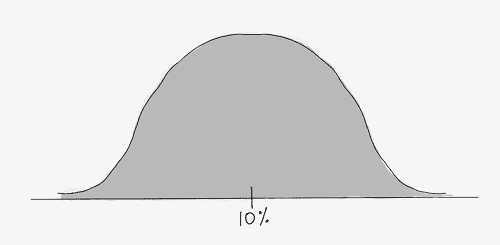
The Sampling Distribution
The sampling distribution is a distribution of sample values we can expect if the null hypothesis were true. Theoretically, the sample distribution is the distribution we would get if we took all possible samples that covered the entire population. The reason the sample distribution is central to hypothesis testing is that the mean of the sample distribution will equal the mean of the true population. So we use the sample distribution to evaluate the sample test statistic and check if our data agree with the null hypothesis.
Reject Region in Hypothesis Testing
If our null hypothesis is true, the test statistic will lie close to the middle of the sampling distribution. However, if our null hypothesis is NOT true, the test statistic will likely be closer to the tails of the sampling distribution.
To make a firm decision, we need a point beyond which we say that the null hypothesis is not true. That point is referred to as the critical value. The region beyond the critical value is referred to as the critical region or the reject region. If the test statistic falls in this region, we reject the null hypothesis. We conclude that the alternate hypothesis is true.
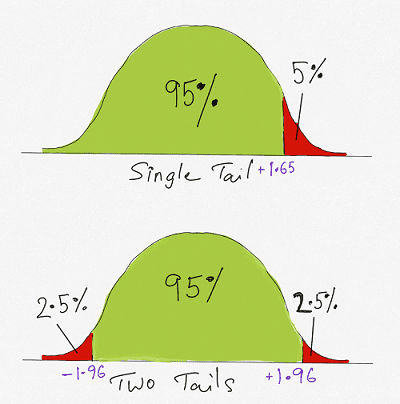
In our example, we are looking for a 5% confidence level. Therefore the critical value and reject region will be computed using a 5% confidence level. The critical value and reject region can be computed using the Z table, Microsoft Excel or another software program.
In Microsoft Excel we use the =NORM.S.INV(0.95) for a single tail critical value of 1.645 as the z value.
We can use the Z table to arrive at the same value too.
Computing the Test Statistic
Once we have the critical value, we run the experiment or gather sample data. Then, we analyze the sample data and compute the sample parameter of interest.
In our example, we randomly sample __ companies of the Russell 3000. We compute the average growth rates of the sample. We then compute the test statistic using this formula.
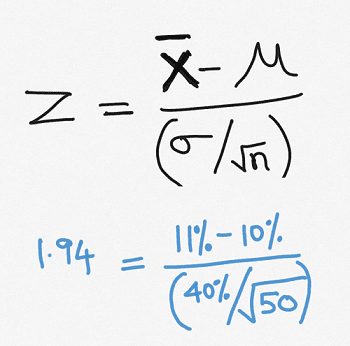
Comparing the Test Statistic and the Critical Value
We compare the sample parameter of interest with the critical value/critical region. We are essentially checking if the test statistic falls in the reject region.
We are ready to conclude the hypothesis test only when we have the sample parameter of interest and the critical value at hand. We check if the parameter of interest falls in the critical regions identified in the earlier step.
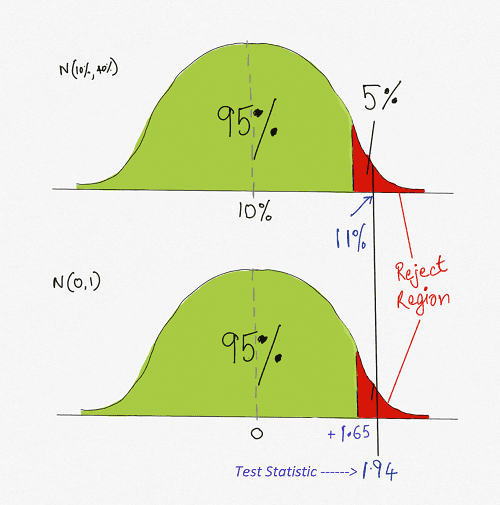
In our example, we can see that the test statistic falls in the reject region.
Concluding the Hypothesis Test
If the parameter of interest falls in the critical regions, we reject the null hypothesis. Only when we reject the null hypothesis can we conclude that we believe the alternate hypothesis!
In our example, we can conclude that we reject the null hypothesis as the test statistic falls in the reject region. Because we reject the null hypothesis, we can say we believe the alternate hypothesis is true. And we conclude that the growth rate of companies of the Russell 3000 is greater than 10% per year!
A Hypothesis Test and A Criminal Trial: Similarities
A hypothesis test is often compared to and explained as a criminal trial. In a criminal trial, we start with the belief “innocent until proven guilty.” Similarly, in hypothesis testing, we assume that the null hypothesis is true. Therefore, we need to present data to disprove the null hypothesis. That is why we say that hypothesis testing is a trial of the null hypothesis. It is not the alternate hypothesis we are testing!
The null hypothesis is similar to the criminal defendant. The data scientist is similar to the prosecutor. It is the prosecutor’s job to prove that the criminal is guilty. The prosecutor or the data scientist/researcher examines the data to present evidence that the null hypothesis is not true. Only if the researcher presents data to prove the null hypothesis is not true, can we conclude that that alternate hypothesis is true. If we do not have evidence to prove the criminal is guilty, he escapes conviction. It does not mean he is truly innocent. It only means that he was not found guilty. Similarly, if we do not have evidence to reject the null hypothesis we can only conclude that we cannot reject the null hypothesis.
Some Facts on the Null Hypothesis
- The null hypothesis is the current belief.
- You are examining or testing the null hypothesis.
- The null hypothesis refers to a specific parameter/value of the true population (not the sample parameter)
- The null hypothesis contains the “equal to” parameter
- If you reject the null hypothesis, you have statistical proof that the alternate hypothesis is true.
- Failure to reject the null hypothesis does not mean you have statistical proof that the null hypothesis is true.
Some Facts on the Alternate Hypothesis
- The alternate hypothesis is what the researcher wants to prove statistically.
- The alternate hypothesis is the opposite of the null hypothesis.
- The failure to prove the alternate hypothesis does not mean that you have proven the null hypothesis.
- The alternate hypothesis usually does not contain the “equal to” parameter.
Sample Size and Sampling to get the Test Statistic
We are looking for evidence that the null hypothesis is not true and “can be rejected”. This evidence is provided by a sample. How should this sample be gathered? How large should the sample be to provide this evidence? The sample must be carefully selected to be representative of the true population of interest. A random sample is best. Other sampling methods include cluster sampling, cluster sampling, stratified sampling, convenience sampling, etc. Each has its advantages and disadvantages, which we will not go into here.
Selecting the sample size is important in hypothesis testing. The sample size chosen impacts the risk of Type I and Type 2 errors. Read more about Type I and Type 2 errors here. The sample size also directly determines the confidence levels and the power of the test. The sample size formula can be resorted to arrive at the sample size.
Hypothesis Testing Tutoring
Please do let us know if we can help you with tutoring for hypothesis testing. Our statistics tutors will be happy to meet with you one on one to help you understand and design and perform a hypothesis test.