We teach you how to build a confidence interval estimate in this article. We start with the basic building blocks of confidence intervals – sampling, mean, etc. all the way to computing different types of confidence intervals for means, proportions, difference in means, etc. Please use this list of confidence interval topics covered in here to jump to the specific of interest to you.
- What is an Unbiased Estimate?
- What is a Point Estimate?
- Point Estimate vs. Interval Estimate
- How do I set a Confidence Level?
- What is the Significance Level
- Difference between the Confidence Level vs. Significance Level
- The Confidence Interval Approach
- What is the Margin Of Error
- Confidence Interval Formula
- Key Implications of the Confidence Interval
- Why Confidence Intervals Get Confusing for Students?
- When to use the z distribution
- When to use the t distribution
- Confidence Interval Formulas
The confidence interval estimate is becoming more important displacing the P value approach that dominated scientific research for many years. The difference between clinical importance and statistical significance in the scientific community is clearer now than before. Clinical importance deals with the size of change or difference between two values being studied. Whereas statistical significance is based on the distribution probabilities – a P value approach.
Relevance of Sampling for Confidence Intervals
It is often difficult or impossible to study an entire population due to either the time needed, or costs involved, or both. So, we resort to taking samples from the population. We study the sample to understand the characteristics and properties of the population. This is what we refer to as inferential statistics – we are inferring the properties of the population from the sample.
There are lots of methods to pick samples. We will leave this discussion for another day. Let us assume we have a truly random sample for now.
What is an Unbiased Estimate?
The average of the random sample is called an unbiased estimate of the population average. This is because if it is truly random, we have not had any bias involved. If a section of the population had a higher chance of being selected into a sample, either due to personal preference or convenience or the design of the survey, the sample would be a biased sample – biased towards that section of the population. Since we have chosen a random sample, we have no bias involved. Therefore, we call the sample average an unbiased estimate of the population average.
What is a Point Estimate?
We refer to the sample average as a point estimate because it is one specific value. Because it came from a sample of the entire population, we are estimating the population average from this average. How likely is it that the sample average is exactly equal to the true population average? Very unlikely!!! Every time you take a sample, you are likely to get a different average.
Point Estimates vs. Interval Estimates
So instead of using a point estimate to describe the true population average, why not provide a range or interval within which the true population will fall? This interval or range is what is referred to as the interval estimate.
Now, please remember that even this interval estimate is also computed or estimated using the data from the sample. So, you still cannot be 100% sure that the true population mean will lie in this interval. You can, however, using our understanding of distributions, have a certain degree of confidence that this interval will contain the true population mean. Therefore, this interval estimate is also referred to as the confidence interval.
The confidence interval width also provides an indication of the uncertainty involved in our estimate of the true population mean. The wider the interval, the less precise our estimate, and vice versa.
How do I set a Confidence Level?
A key ingredient in estimating an interval estimate is the confidence level you want to have regarding the true population mean. In other words: how sure do you want to be that the true population mean lies in the interval estimate (confidence interval) you are generating?
The confidence level should be a function of how importance accuracy is to whatever you are studying. For example, if you are looking at the air pressure in a ball for a high school’s soccer game, you may not be too concerned with a little inaccuracy. So, a 90% confidence level may be appropriate. If you are looking at the wall thickness in a heart stent, an error could lead to death. Here you will want a 99% confidence level or higher! The confidence level used most often in practice is a 95% confidence level.
Most academic papers use a 95% confidence level. You can read more about the use of confidence intervals here.
- Understanding Confidence Intervals from One or More Studies (Finch, Cumming 2008)
- Using the confidence interval confidently (Hazra 2017)
- The Use of Confidence Intervals in Reporting Orthopaedic Research Findings (Vavken, et al 2009)
What is the Significance Level?
The significance level is simply 100% minus the confidence level. If your confidence level is 95%, your significance level is 100%-95%=5%. The significance level is used as a cut-off point when deciding if the results are significant. We fix a value out of need. A value at 4.9% is not very different from 5.1%! But since we have to draw the line somewhere, we use the significance level as a cut-off point when making decisions.
Difference between the Confidence Level vs. Significance Level?
You usually do not compare and contrast the confidence level and the significance level. They are related –and are complimentary to each other. Remember that the significance level is simply 100% minus the confidence level!
The Confidence Interval Approach
Now that we have discussed the various components required to establish a confidence interval, let us talk about how to compute the confidence interval. The confidence interval is arrived at by taking the mean and adding/subtracting a margin of error.
Confidence Interval = Mean +/- Margin of Error
The sample average gives you the mean. The margin of error is a function of the confidence level you want and the standard deviation and size of the sample.
What is the Margin of Error
What is the margin of error? You know that each time you take a sample, the sample average or point estimate will differ. You also know that the sample average is likely not the true population average. But because it is unbiased you know that the sample average is likely to be close to the true population average. The margin of error is some value or distance from the sample average which you believe contains the true population average – with some level of confidence. This distance goes both above and below the sample average.
The margin of error is a function of the confidence level you want, the standard deviation of the sample and the size of the sample.
If you know the true population standard deviation:
Margin of error = Critical value x Standard deviation for the population.
If you do NOT know the true population standard deviation:
Margin of error = Critical value x Standard error of the sample.
Confidence Interval Formula
Now, with the margin of error defined, let us look again at the confidence interval formula using the z distribution and the t distribution. We will look at when to use the z distribution vs when to use the t distribution.

Notice that you need the following four values to arrive at the confidence interval.
- Sample average
- Sample size
- Sample standard deviation
- Critical value based on the confidence level
All the above values are arrived at from the sample except the critical value. The critical value is arrived from from the z or t distribution based on the confidence level. And the confidence level is usually provided in the question or is a decision you need to take.
Key Implications of the Confidence Interval
The width of the confidence interval depends on the following:
- Sample size: The sample size n is in the denominator. This means that the larger the sample size, the larger the margin of error and therefore wider the confidence interval.
- Sample standard deviation: The sample standard deviation is in the numerator. This means that the larger the variance or dispersion in the sample, the larger the margin of error and therefore wider the confidence interval.
- Confidence level: The confidence level which is reflected in the z or t value is in the numerator. Therefore, the more confident you want to be, the wider your margin of error and therefore the wider the confidence interval.
Why Confidence Intervals Get Confusing for Students?
The confidence interval computation gets confusing for students because there are many factors to be considered in selecting the formula to be used. These include:
- When to use the z distribution; vs
- When to use the t distribution?
Are we dealing with a:
- Confidence Interval for a Mean; or
- Confidence Interval for a Proportion?
AND as if that were not enough,
- Are samples paired or unpaired?
- Are samples independent?
We will look at the above decisions one by one below.
When should we use the Z Distribution?
We can use the z distribution only if we know the population’s true standard deviation. If we do not know the true population standard deviation, we must use the student’s t-distribution*.
* Note that we can end up using the z distributions even when we do not know the true population standard deviation if we have met a specific criteria – have a “large” sample size. A sample is considered a “large” sample if it has more than 30 data points.
When should we use the Students t Distribution?
As we usually do not know the population’s true standard deviation, we must technically be using the t-distribution all the time. We therefore default to using the t-distribution. The student’s t- distribution with fatter tails is more forgiving than the z distribution. The student’s t-distribution gives you a wider confidence interval.
Here is an amazing fact. As the sample size gets large, the t-distribution and the z distribution get almost identical!
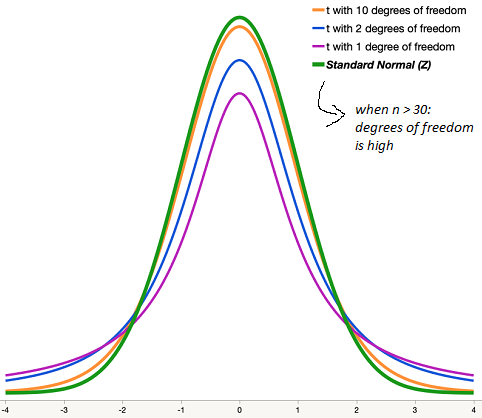
Source: This image was taken from jmp.com.
If you plot the values of z and t distributions in a spreadsheet and look at the difference between a z and t distributions, you will notice that the difference gets close to zero as soon as the sample size gets larger than 30.
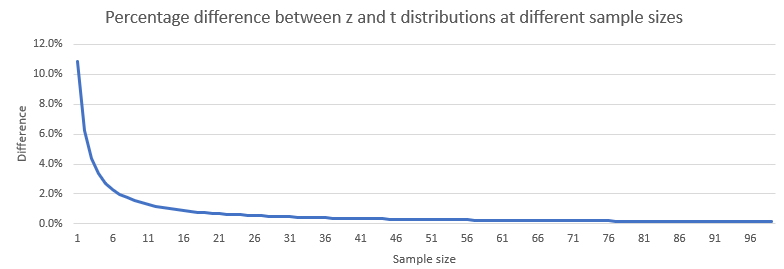
So, you might have well used the z distribution when the population size is large. The accepted practice is to use the z distribution if the sample size is greater than 30.
Another constraint on the t-distribution is that the underlying distributions are assumed to be normal or close to normal distributions. We may not be able to verify this always. We therefore must resort to larger sample sizes to use the t-distribution. We can use the t-distribution when sizes are large because we know that when sample size > 30, the sampling distribution gets normal even if the underlying distributions are not normally distributed.
Note: If I am unsure about which distribution to use, I go with the t-distribution! Why? I default to the t- distribution as it is more forgiving or provides a wider confidence interval.
Confidence Interval Formulas
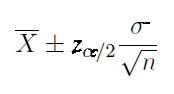
Use this confidence interval formula for a mean when the population standard deviation is known.
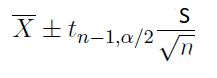
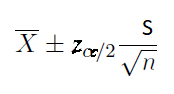
If the true population standard deviation is not known but the sample size is large, use this confidence interval formula for the mean.
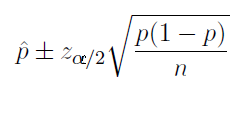
Confidence Intervals for a Proportion
Comparing Two Means
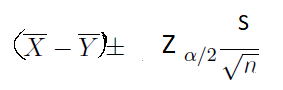
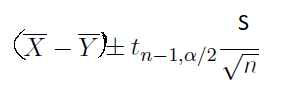
If you are working with paired samples you can use this formula for comparing the difference between two means or compute the confidence interval of the difference between two means. Note that when you are looking for the difference between two means in a paired sample, the sample sizes are the same. This is used only when the sample size is large (n>30).
If the sample size is small and underlying populations are normal, you can use this formula to compute the confidence interval of the difference between two means. This formula is usable if the sample size is large too.
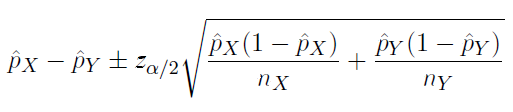
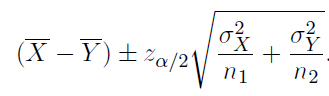
If you are working with unpaired samples and the true population average is known, you can use the formula below.
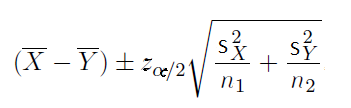
If you are working with unpaired samples but the true population average is NOT known, you can use the formula below.
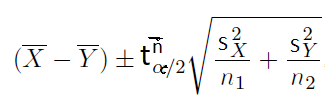
Unpaired samples – Unknown variances and underlying populations are normal
Comparing Two Proportions